Most probably you have heard of dtrace. And not so much about the Linux alternatives of it. Well today I decided to give the Linux perf tool a shot while trying to find performance problem on a heavily loaded LAMP server.
Installing perf
Actually installing perf on Ubuntu 12.04 is really straightforward :
sudo apt-get install linux-base linux-tools-common linux-tools-`uname -r | sed 's/-[a-z]\+$//'`
Collecting performance events
After if finished installing you can run a system wide profiling with :
perf record -a
And stop with Ctrl-C, to finish collecting the data.
perf report
will show the what processes are using the most CPU:
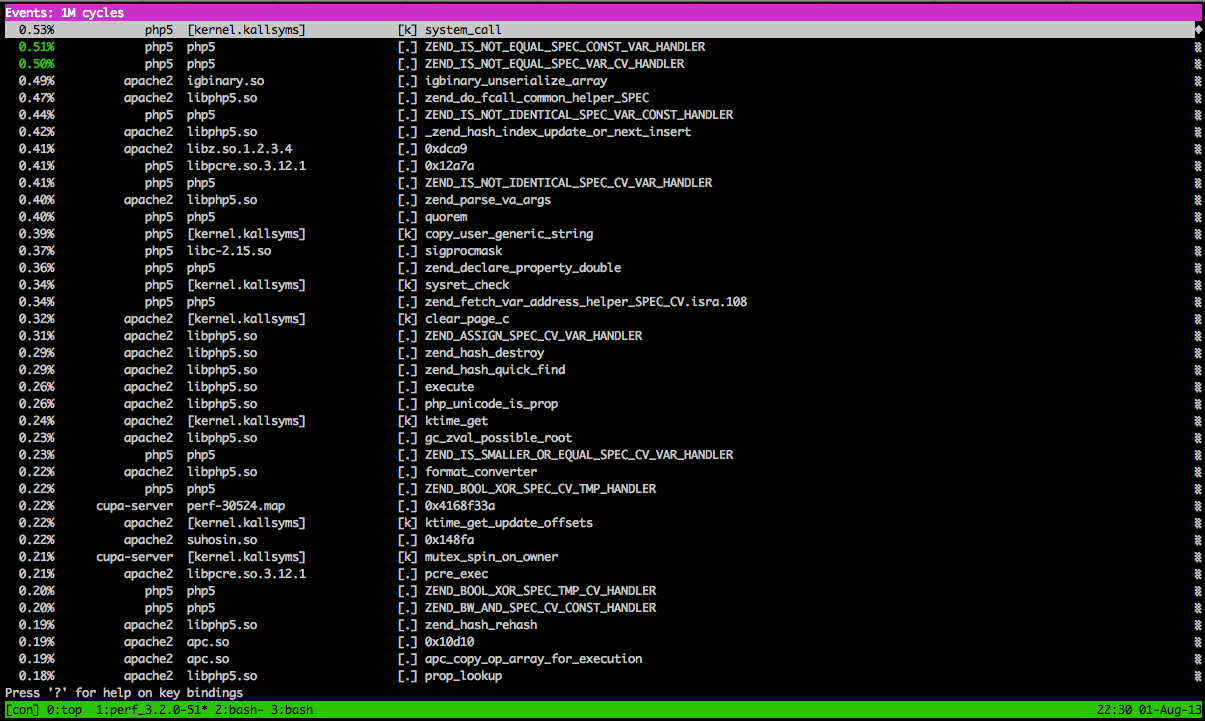
Obviously most CPU goes to apache(mod_php) and and php5 standalone processes. And looking at the names of the functions, on top is the garbage collection. If you don’t have the debug symbols installed then you won’t see this breakdown by function but instead just total process percentage which is not so useful.
To install debug symbols install the php5-dbg package, and update the perf buildid database.
perf buildid-cache -r /usr/lib/apache2/modules/libphp5.so -v
perf buildid-cache -v -a /usr/lib/debug/usr/lib/apache2/modules/libphp5.so
perf buildid-cache -v -r /usr/bin/php5
perf buildid-cache -a /usr/lib/debug/usr/bin/php5 -v
Of course just knowing which function is taking up a lot of CPU is very useful but even more useful is to have the backtrace of who called it. Luckily perf does that. Just add -g to the record command:
perf record -a -g
And after with :
perf report --show-total-period
you can expand the function to see the callers with E and C shortcuts. Or use :
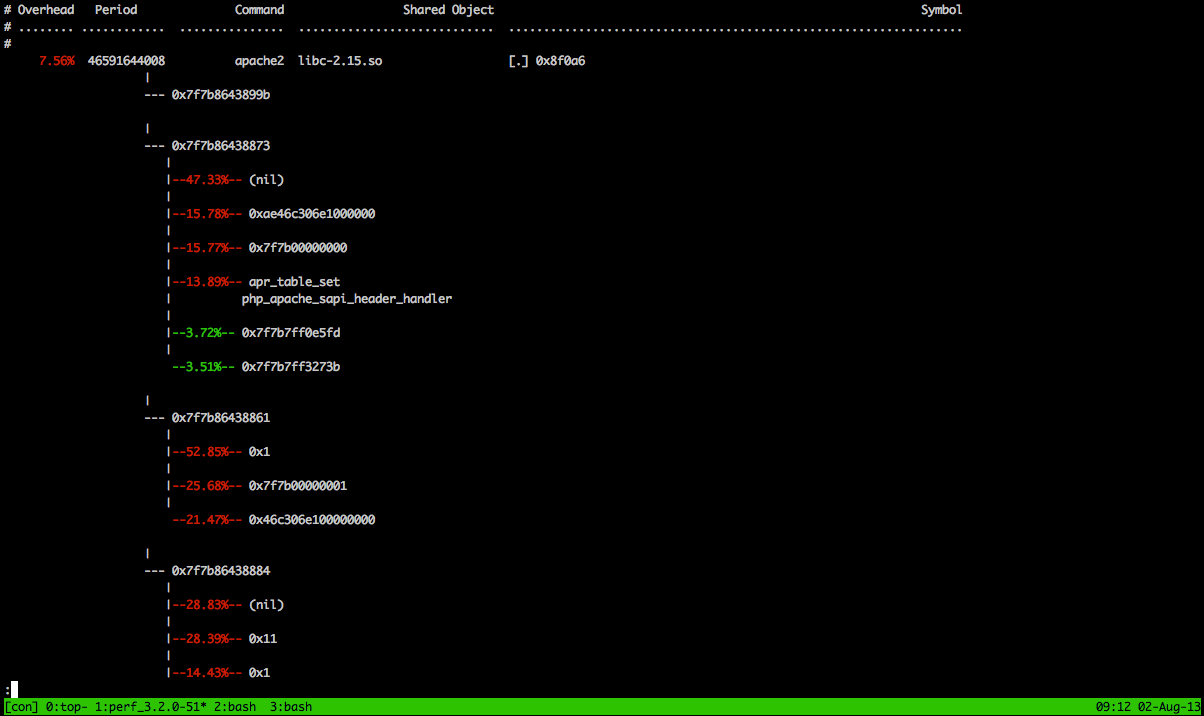
perf report --show-total-period --stdio
To see it as ASCII tree in the console like this:
The profiling can be done only for a single running process :
perf record -p 30524 # gather data for process with PID 30524
Or for a single execution of a command:
perf record wget http://tgif.com/
Also there is simple statistics mode :
$perf stat  -p `pgrep apache2| head -n1`
^C
 Performance counter stats for process id '2039':

         17.213000 task-clock                #    0.006 CPUs utilized
                96 context-switches          #    0.006 M/sec
                 2 CPU-migrations            #    0.000 M/sec
                 1 page-faults               #    0.000 M/sec
        36,184,077 cycles                    #    2.102 GHz                     [25.83%]
        18,591,791 stalled-cycles-frontend   #   51.38% frontend cycles idle    [21.78%]
         7,480,284 stalled-cycles-backend    #   20.67% backend  cycles idle
        13,575,815 instructions              #    0.38  insns per cycle
                                             #    1.37  stalled cycles per insn [90.53%]
         1,975,651 branches                  #  114.777 M/sec                   [79.87%]
           127,819 branch-misses             #    6.47% of all branches         [48.80%]

       2.732758278 seconds time elapsed
This is the default set of collected performance events, but you can sample more with the -e switch. For a list of all supported events run:
perf list
You can find more details and examples on the project wiki .