Building Python 3.5 for CentOS

Update: As per Alexander Todorov’s suggestion using https://www.softwarecollections.org/ is much easier and saves a lot of trouble compiling.

So after git it’s time to upgrade python. CentOS 7 has python 3.4, but there are some small but very annoying incompatibilities with 3.5. And it seems that 3.5 will be the major python 3 release. So here we go:

RPM build chroot

First lets create the chroot directory and  initialize the  rpm database   :

Next  install the latest centos-release package,  yum and add the EPEL inside the chroot:

Next we continue inside the chroot :

Building RPMs

Next we need to install gcc, and few other packages that are needed to compile RPMs and pyton.

Pick a python 3.5 SRPM from https://apps.fedoraproject.org/packages/python3 .

And install it :

You can just ignore the warning about missing users. Go to SPECS directory and edit python3.spec so that :

becomes

This has something to do with a circular dependency of the rewheel package. Now we can build python with:

After the build is done we can check if the packages are installable:

Now let’s try to rebuild with the rewheel package. We will need python-rpm-macros, python3-pip and python3-setuptools  and a bunch of other packages for building them 🙂

Change back python3.spec to:

And now rebuild python3 again:

After the build finishes we have the RPMs in ~/rpmbuild/RPMS:

Exit the chroot and install the newly build python 3.5 packages :

Lazy load nvm for faster shell start

NVM is a version manager for node that makes using specific versions of Node a breeze. I prefer to use it on my development machine instead of system wide node as it gives much more control with almost no added complexity.

Once you install it , it adds the following snippet to your .bashrc :

and everything just works 🙂

Except that on my laptop this adds 1-2 seconds of start up time to each new shell I open. It’s a bit of annoyance and I don’t need it in every terminal session I start, so I though maybe there will be a way to load it on demand.

After fiddling a bit with it I replaced the NVM snippet with the following:

Now nvm, node and npm are  loaded on their first invocation, posing no start up time penalty for the shells that aren’t going to use them at all.

Edit: Thanks to jonknapp’s suggestion, now the snippet is more copy paste friendly.

Edit: fl0w_io made a standalone script out of it to include in .bashrc

Edit: sscotth made a version that will register all your globally installed modules

Building latest git for CentOS

CentOS is a great operating system, but recent versions of software packages is not one of its virtues. For example the current CentOS 7.2 ships with git version 1.8.3 released 2013, almost 3 years ago. And by that time git gained quite some useful features. So lets see how to build RPMs with latest git.

RPM build chroot

First thing is to make a chroot where to build the RPM, because there are a lot of dependencies required for building, which needs to be cleaned up afterwards. Much easier is to just delete the whole chroot dir 🙂

First lets create the chroot directory and  initialize the  rpm database   :

Next  install the latest centos-release package and yum inside :

Next we continue inside the chroot. Lucky us, systemd-nspawn makes it trivial to work inside the chroot :


Building RPMs

Next we need to install gcc, and few other packages that are needed to compile RPMs .

And now we need a git SRPM to build. We can just grab the Fedora one which has git 2.7.1. Here https://apps.fedoraproject.org/packages/git/overview/ are all Fedora builds, and I picked the Rawhide version. Clicking on it takes us to a page with build information and there is also a link to download the SRPM for this build. Lets install it :

You can just ignore the warning about missing users. Go to SPECS directory and try to build the RPMs:

Ok, we need to install some dependencies to be able to build. Lets just install them:

and run rpmbuild again:

After the build finishes we have the RPMs in ~/rpmbuild/RPMS:

Exit the chroot and install the following packages for a minimal git installation:

Not, so bad 🙂 Next time I will check how to create a repository .

[Javascript] Promise me to keep your order

Promises are currently one of the best tools JavaScript has to offer to keep track of all the asynchronous calls in a program. If you don’t use them already you definitely should start.  But in this post I want to share a technique which even if its dead simple that wasn’t quite obvious how to achieve right away from the Promise documentation.

The parallel approach

The problem I had at hand was database operations. Several deletes which I wanted to be sure that all of them have completed before continuing . Which is quite easy to do with array of Promises like this :

This works fine generally, but in my case these delete operations were kind of heavy, and were putting a lot of load on the database. Starting all 3 of them at the same time is not helping at all.

A not so working serial execution

So I decided to run them serially instead of parallel with the obvious approach:

Just chaining the promises with .then() doesn’t quite work as the .then() handlers are invoked all at the same time so once the first delete operation is resolved, the next two are again started simultaneously.  Thanks to Quabouter , this is more clear now. The return value of a .then() is passed to Promise.resolve df and the resulting promise is used to resolve the next then(). That’s why returning simple value ( or no value ) will fire the next .then() while a returning a promise will block until it is resolved.

I had to search for a different approach

The final solution

According to .then() documentation it returns a new Promise, which makes possible for chaining .then() calls what is not quite clear is that when the function passed to then returns a new Promise it is used to fulfil the Promise returned by then(). With this knowledge it is possible to rewrite the loop like this :

This gives the serial execution of dbDelete, where the next operation starts only after the previous has finished.

Hope this helps somebody 🙂

Node.js change visible process name

When writing command line tools, sometimes there is sensitive information (like passwords) on the command line that shouldn’t be visible right away in the process list. I know what you are thinking now “Passwords on the command line is a big fat NO”. Yeah maybe from security viewpoint this is a horrible thing to do, but from the usability perspective is pretty convenient. And as reality has proven so many times , convenience triumphs over security. But being a bit precautious won’t hurt, so let’s see how we can hide that password.

Process name in Node.js

Node.js has support for retrieving and setting the process name along with the passed command line argument. There is process.title property which according to the documentation is a getter/setter for the process name.

So our first guess is :

The result of this is not what you’d expect. It sets the process name and command line to just ‘node’. That’s because process.title contains only the process name and no command line arguments:

Setting it will overwrite the both the process name and command line arguments though.

So we can overwrite the visible process name but we loose some information that might be nice to have like, what is this process, and what command line arguments it was ran with.

The good news is that we have the command line arguments in process.argv so all we have to do is reconstruct the command line and append it to process.title.

Change the visible process name

Here it goes:

This works quite well if you don’t change the length of the command line. Making it shorter also works fine, but making it longer will lead to truncated string as the memory for argv is preallocated by the C runtime, and Node just overwrites that, meaning it cannot change its length.

Running this with ‘password’ on the command line gives:


Quck and (not so) dirty compressing reverse proxy.

While working on a couchapp recently I found out quite interesting fact. CouchDB doesn’t support   the gzip/deflate HTTP responses. And with a view that’s several MB, on a slow connection it was a lot pain using the app.

My first thought was, no problem, my CouchDB is behind nginx anyway, lets just turn on gzip compression in nginx. And while that was super simple to do, it yielded an undesired effect. The responses were now compressed, but nginx strips off Etags headers, and there is no way around it. Without the Etag queries always return full responses, even if the data hasn’t been modified. With them, a short 304 reponse is sent when there is no change.

Unhappy with nginx approach to way too strict HTTP, I decided to write my own compressing proxy. Fortunately thats super simple with nodejs/iojs. Its just a matter of gluing few modules together 🙂

First install the modules:

Then save this as proxy.js in the same directory:

And voila , now run:

And you have gzipped responses from CouchDB on port 8012.


Unfrozen, or how to get that file back from Eclipse

I was happily working on a small java project, and after just creating a new Java class, and typed around 100 lines in the Eclipse editor, the whole IDE  froze.  It seems there is a bug in Luna that will freeze the IDE on out of memory condition, and I have just hit it.

100 lines is not that much of a loss generally, I can write them again. But why? Aren’t computers supposed to save us from the manual work. I wanted this file back 🙂 Quick check on the file system showed that after creating the class Eclipse saved and empty class inside. I had to find another way I guess.

What if I somehow manage to connect a Java debugger and search for the file in memory. Unfortunately I am not that proficient in Java and  doing all the research on how to do it may take quite some time.  So lets see do I really need a debugger ? I just need the file, and it is somewhere in the Eclipse process memory. Getting the whole memory of a process is quite easy in Linux :

And voila, we have the whole memory of the process saved to core.<PID> . Now lets find that file. strings comes to mind instantly :

And I started searching for occurrence of ‘class MetadataInfo’ ( that was my class name) . Unfortunately while  MetadataInfo had plenty of instances none of them was preceded by a class keyword and none was actually in the content of my file.  Hmm, maybe the file isn’t stored as plain string, maybe it is some kind of tree for easier syntax t highlighting, as there were pieces of the file all over the place. But then it occurred to  me that the file is probably stored in UTF16 in memory as Java is very much into UTF16. Quick check shows that strings supports several encodings :

Nice! Lets try 16-bit LE  as I am on an Intel machine:

Now searching  for ‘class MetadataInfo’ finds several occurrences of the full file, I guess because of the Local History that Eclipse keeps for each file.  Just copied one that seems good enough, saved it to file and killed the frozen Eclipse w/o significant data loss.


Btrfs defragment

I have BTRFS for root and home volumes on my latop, and today I found out that  BTRFS supports defragmentation. It’s interesting to check whether defragmentation has measurable performance impact, so I did a quick test.

The easiest thing was to measure the boot time as reported by systemd .  So I did a couple of restarts, recorded the boot times systemd-analyze reports :

Before defragment Kernel initrd user Total
Boot 1 2.743 2.015 4.81 9.568
Boot 2 2.749 1.913 4.757 9.419
Boot 3 2.79 1.882 3.209 7.881
Avegare 2.761 1.937 4.259 8.956

Then I did a :

And recorded the new boot times :

After defragment Kernel initrd user Total
Boot 1 2.751 1.734 3.37 7.855
Boot 2 2.743 1.76 4.287 8.79
Boot 3 2.746 1.747 2.847 7.34
Average 2.747 1.747 3.501 7.995

That’s a whole second less, or about 11% improvement.  Not so bad at all, given that the disk is Samsung 840 Pro SSD, and is quite fast anyway.

tmux on Solaris

In the last month my work is somewhat related to Solaris and since I really got used to tmux I kind of miss it. Unfortunately it turns out Solaris is not the happy Linux land I am used to. One does not simply  dowload, ./configure and make install stuff in Solaris. Not without   the proper spells 🙂 So here is an attempt to document my experience to build static tmux binary, that doesn’t require libevent or ncurses shared libraries. I used a VM I had with gcc installed from openCSW.

First thing libevent, download and unpack it. Then:

Next goes ncurses,  download  and unpack. Then:

And finally we can compile tmux itself. This is abit trickier , as it seems tmux doesn’t directly support Solaris. Download and unpack.  You need to apply the following patch:

Use gpatch, obviuosly patch in Solaris carries some braindead Unix legacy which I don’t even want to know about:

Then we setup the CPP/LDFLAGS, ./configure and make:

Thats it 🙂 In the tmux source directory we have a tmux binary that depends only on system libraries so you can copy it to other Solaris boxes and use it there.

Linux system profiling with perf

Most probably you have heard of dtrace. And not so much about the Linux alternatives of it. Well today I decided to give the Linux perf tool a shot while trying to find performance problem on a heavily loaded LAMP server.

Installing perf

Actually installing perf on Ubuntu 12.04 is really straightforward :

Collecting performance events

After if finished installing you can run a system wide profiling with :

And stop with Ctrl-C, to finish collecting the data.

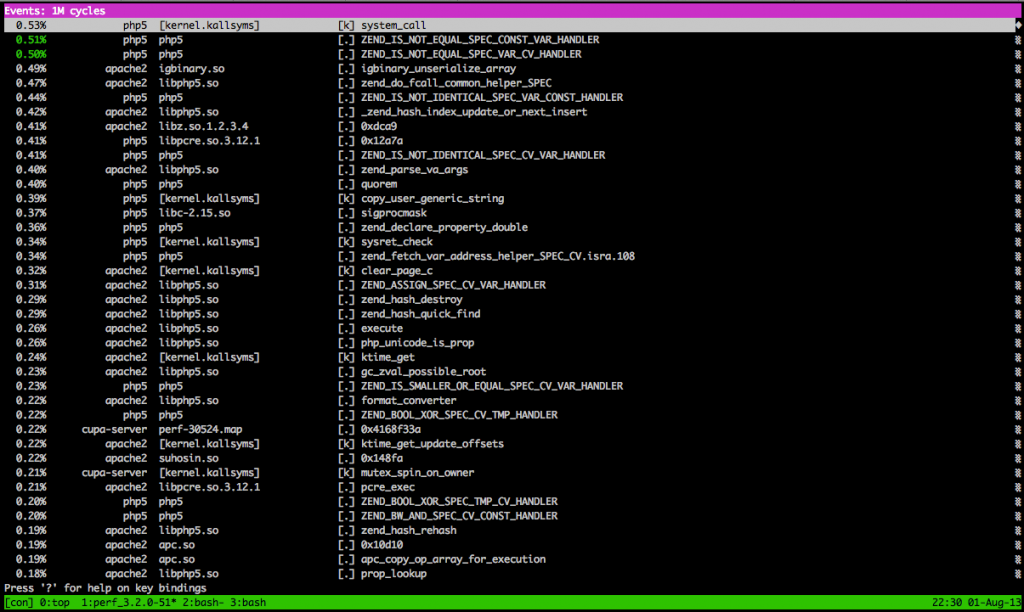
will show the what processes are using the most CPU:

perf report

Obviously most CPU goes  to apache(mod_php) and and php5 standalone processes. And looking at the names of the functions, on top is the garbage collection. If you don’t have the debug symbols  installed then you won’t see this breakdown by function but instead just total process percentage which is not so useful.

To install debug symbols install the php5-dbg package, and update the perf buildid database.

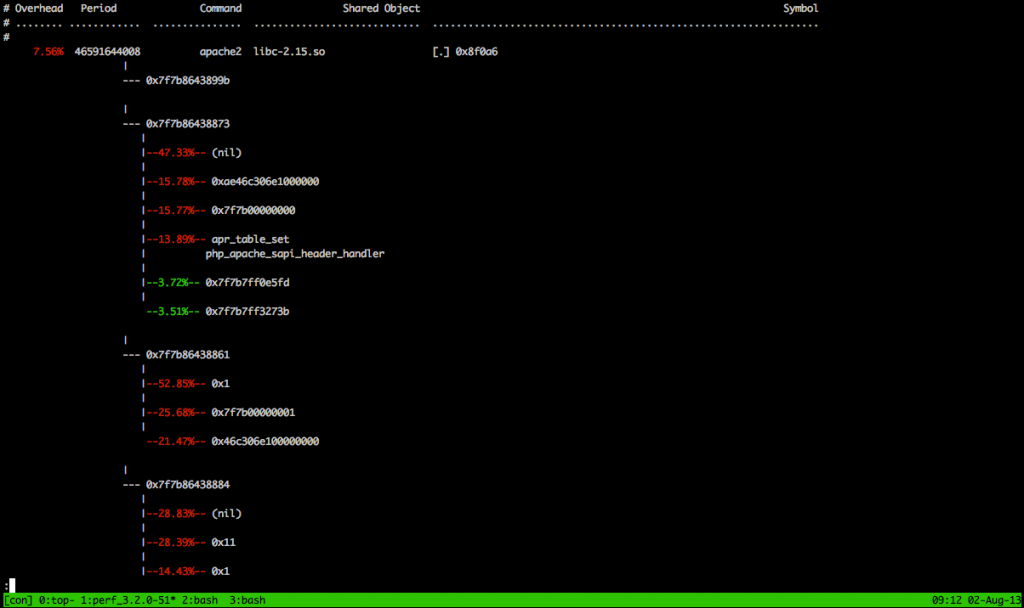
Of course just knowing which function is taking up a lot of CPU is very useful but even more useful is to have the backtrace of who called it. Luckily perf does that. Just add -g to the record command:

And after with :

you can expand the function to see the callers with E and C shortcuts. Or use :

To see it as ASCII tree in the console like this:

perf report call tree

The profiling can be done only for a single running process :

Or for a single execution of a command:

Also there is simple statistics mode :

This is the default set of collected performance events, but you can sample more with the -e switch. For a list of all supported events run:

You can find more details and examples on the project wiki .